SCHOOL PROJECT
BMO Research
Analysis of BMO’s Online Mortgage Application
My Role
Interview, Eye tracking, brainwave and shimmer analysis, Qualitative Analysis
Tools
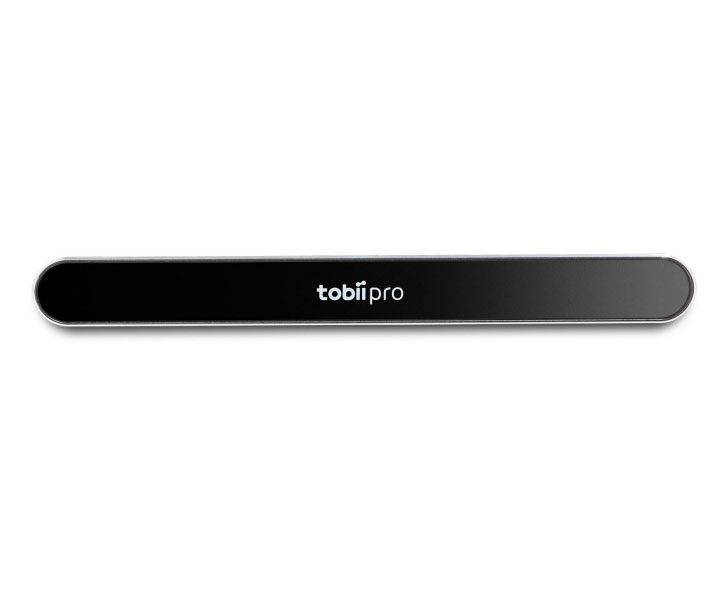
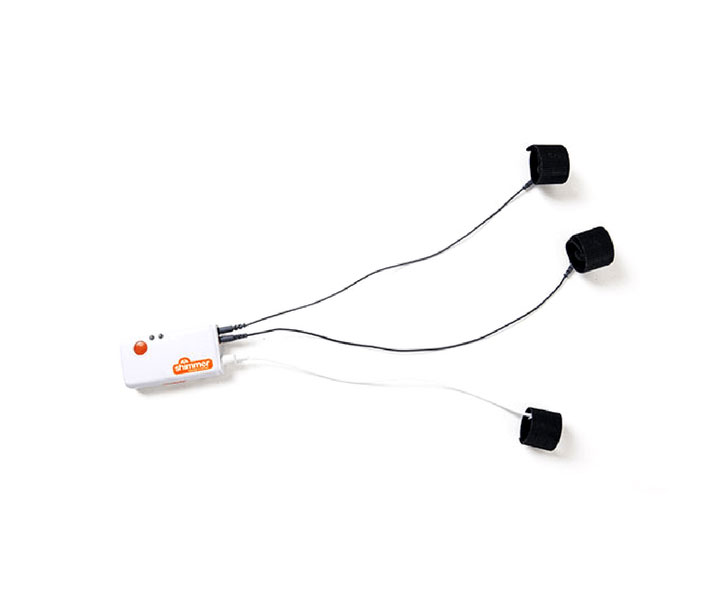
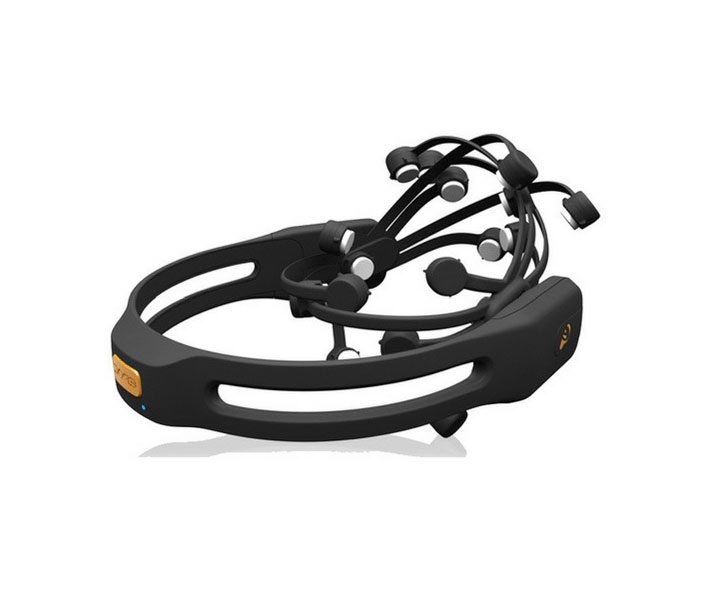
Eye tracking, Brainwave sensor, biometric shimmer sensor
Product
Final analysis report
Working with
Milos Rad
What I learned?
1) Interviewing people is tricky when they know they’re being observed. Although you can still get a lot from the interviews, you have to consider different, more natural settings options.
2) Eye tracking testing of the website is a must! There’s so much information you can get from it, I can’t imagine designing it without it anymore
3) Color coding is very useful way to track important information. Next time I would assign a group of keywords to one color. Going with too many colors makes the analysis too complex
4) I love doing research! The biggest part I loved was the surprise moment when as a UX/UI designer you think that other people see things the same way. They don’t and that was the most challenging thing I would love to solve!
The purpose of this study was to observe and examine the online mortgage account opening experiences at the Bank of Montreal (BMO).
The goals:
● To conduct a detailed evaluation of the mortgage account opening experiences at BMO.
● Carry out an assessment focused on testing ease of use, time management, and clarity of information.
● To see how BMO’s mortgage account opening experience compares and contrasts to other key banks.
Objectives:
● Are users finding the online mortgage application with ease?
● Are there any errors/distractions along the way that prevents them from finding the application?
● What is the difficulty level of completing the online mortgage application in terms of time?
Participant Characteristics:
The study was conducted with participants of a specific age group of 50-65, possessing potentially both low-tech and high-tech backgrounds, with possible experience of applying for mortgage previously.
Collecting data with IMotions biosensors
iMotions biosensors were used to quantify engagement and emotional responses.
Screen-based eye tracking was used to record and analyze responses to the stimuli: the online application process.
Analysis of data
Users research notes, transcripts, images, videos and audio recordings were stored and analyzed with Dovetail app.
The notes were first read to get a feeling for patterns. Then, highlights were being tagged with simple keywords like: error; emotional response keywords like: frustrated, angry, happy etc. Before tagging was done, insights could be gain from the data.
Color coding
The keywords related to: emotions, errors and process were color coded to allow grouping and filtering information gathered from notes. As the understanding of the user emotions and pain points grew during the notes and materials analysis, keywords were adjusted accordingly.


